
Performance Summary
This section provides metrics and results of SAP performance testing.
Test Setup
| Test Runner | |
|---|---|
| Operating System | Ubuntu 20.4 |
| RAM | 32GB |
| Core | 16 |
| Appliance | |
|---|---|
| Build | 2.9.0.7341 |
| RAM | 16GB |
Process
Scripts are written on top of the Locust Framework for load and stress testing. The testing is done for create, read, update, and delete (CRUD) key operations with respect to different numbers of virtual users (VUS) over parallel connections, one for every virtual user.
The testing also done to determine the response for uploading keys by a number (N) of virtual users in time (T).
CRUD Operations
Expand the headings below to view performance numbers.
Time taken per key upload with respect to virtual users
| Virutal Users | Minimum | Average | Maximum |
|---|---|---|---|
| 10 | 6.712 | 9.998 | 16.605 |
| 30 | 9.7 | 22.8 | 33.673 |
| 50 | 11.6 | 32.64 | 49.936 |
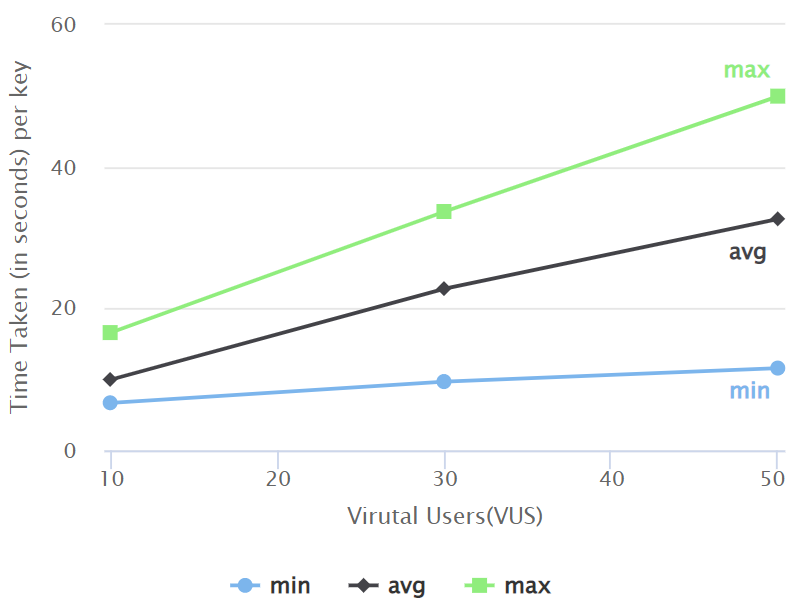
In the graph above:
-
X-axis represents the increment of virtual users.
-
Y-axis represents the time taken by a virtual user to perform BYOK operations.
-
3 line graphs display information for minimum (min), average (avg), and maximum (max) time taken by one of the virtual users running at that time.
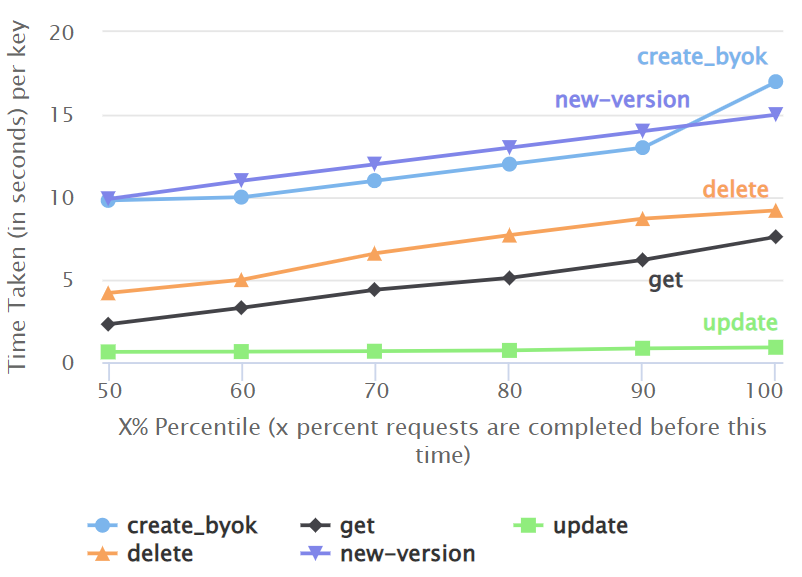
Response with request coverage in percentile (10 VUS, 180 seconds)
| X% percentile | create_byok | get | update | delete | new-version |
|---|---|---|---|---|---|
| 50 | 9.8 | 2.3 | 0.62 | 4.2 | 9.9 |
| 60 | 10 | 3.3 | 0.64 | 5 | 11 |
| 70 | 11 | 4.4 | 0.66 | 6.6 | 12 |
| 80 | 12 | 5.1 | 0.71 | 7.7 | 13 |
| 90 | 13 | 6.2 | 0.84 | 8.7 | 14 |
| 100 | 17 | 7.6 | 0.9 | 9.2 | 15 |
Here, X% percentile indicates that X percent requests are completed before this time.
In the graph above:
-
X-axis represents X% (percentile) of request time. It means, X% requests have taken time less than or equal to Y-axis value at X%.
-
Y-axis represents the time taken by a virtual user to perform any CRUD operation.
-
An individual virtual user has performed these CRUD operations sequentially, whereas all the virtual users are spawned in parallel.
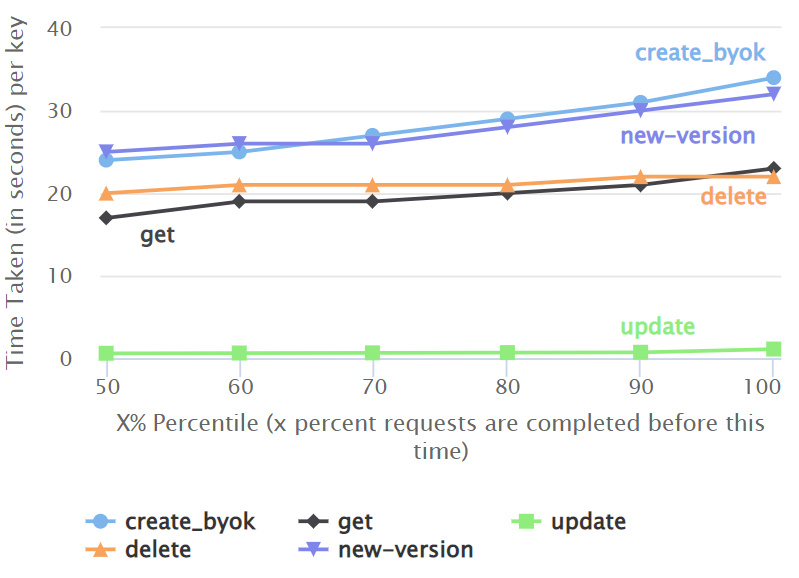
Response with request coverage in percentile (30 VUS, 180 seconds)
| X% percentile | create_byok | get | update | delete | new-version |
|---|---|---|---|---|---|
| 50 | 24 | 17 | 0.59 | 20 | 25 |
| 60 | 25 | 19 | 0.62 | 21 | 26 |
| 70 | 27 | 19 | 0.64 | 21 | 26 |
| 80 | 29 | 20 | 0.67 | 21 | 28 |
| 90 | 31 | 21 | 0.71 | 22 | 30 |
| 100 | 34 | 23 | 1.1 | 22 | 32 |
Here, X% percentile indicates that X percent requests are completed before this time.
In the graph above:
-
X-axis represents X% (percentile) of request time. It means, X% requests have taken time less than or equal to Y-axis value at X%.
-
Y-axis represents the time taken by a virtual user to perform any CRUD operation.
-
An individual virtual user has performed these CRUD operations sequentially, whereas all the virtual users are spawned in parallel.
-
trepresents time taken for a key operation whenNvirtual users are running in parallel.
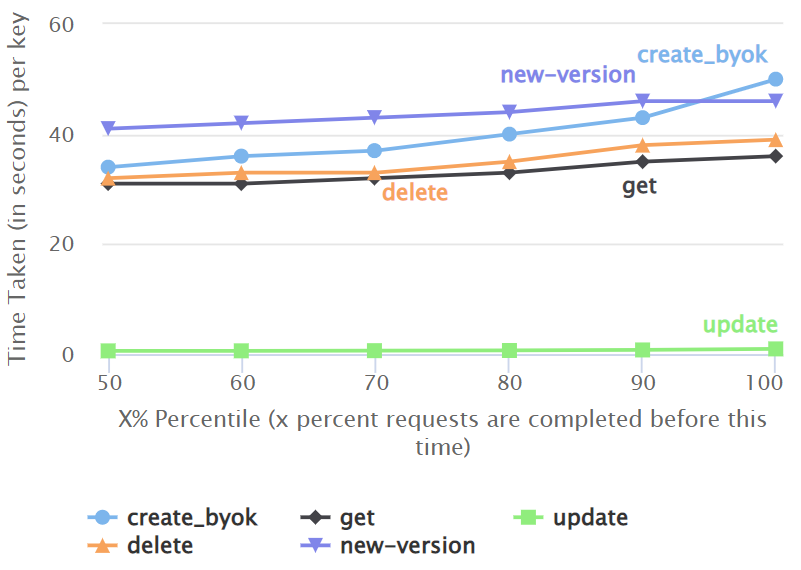
Response with request coverage in percentile (50 VUS, 180 seconds)
| X% percentile | create_byok | get | update | delete | new-version |
|---|---|---|---|---|---|
| 50 | 34 | 31 | 0.59 | 32 | 41 |
| 60 | 36 | 31 | 0.6 | 33 | 42 |
| 70 | 37 | 32 | 0.63 | 33 | 43 |
| 80 | 40 | 33 | 0.66 | 35 | 44 |
| 90 | 43 | 35 | 0.76 | 38 | 46 |
| 100 | 50 | 36 | 0.95 | 39 | 46 |
Here, X% percentile indicates that X percent requests are completed before this time.
In the graph above:
-
X-axis represents X% (percentile) of request time. It means, X% requests have taken time less than or equal to Y-axis value at X%.
-
Y-axis represents the time taken by a virtual user to perform any CRUD operation.
-
An individual virtual user has performed these CRUD operations sequentially, whereas all the virtual users are spawned in parallel.
-
trepresents time taken for a key operation whenNvirtual users are running in parallel.
Key Upload
This section provides performance numbers for uploading keys by a number (N) of virtual users in time (T).
Expand the headings below to view performance numbers.
Number of keys uploaded by virtual users in 100 seconds
| Virtual Users | Number of Keys |
|---|---|
| 10 | 74 |
| 30 | 90 |
| 50 | 95 |
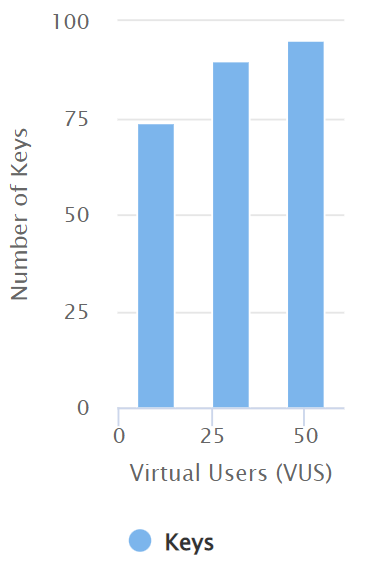
The graph above shows the number of keys uploaded in t time when N virtual users are spawned in parallel. Also, it indicates throtlling condition breakpoints and helps you calculate throughput per second (TPS).
Response for upload with percentile request coverage
| X% percentile | 10 VUS | 30 VUS | 50 VUS |
|---|---|---|---|
| 50 | 9.7 | 24 | 39 |
| 60 | 11 | 26 | 40 |
| 70 | 11 | 27 | 41 |
| 80 | 12 | 28 | 42 |
| 90 | 14 | 30 | 44 |
| 100 | 17 | 31 | 49 |
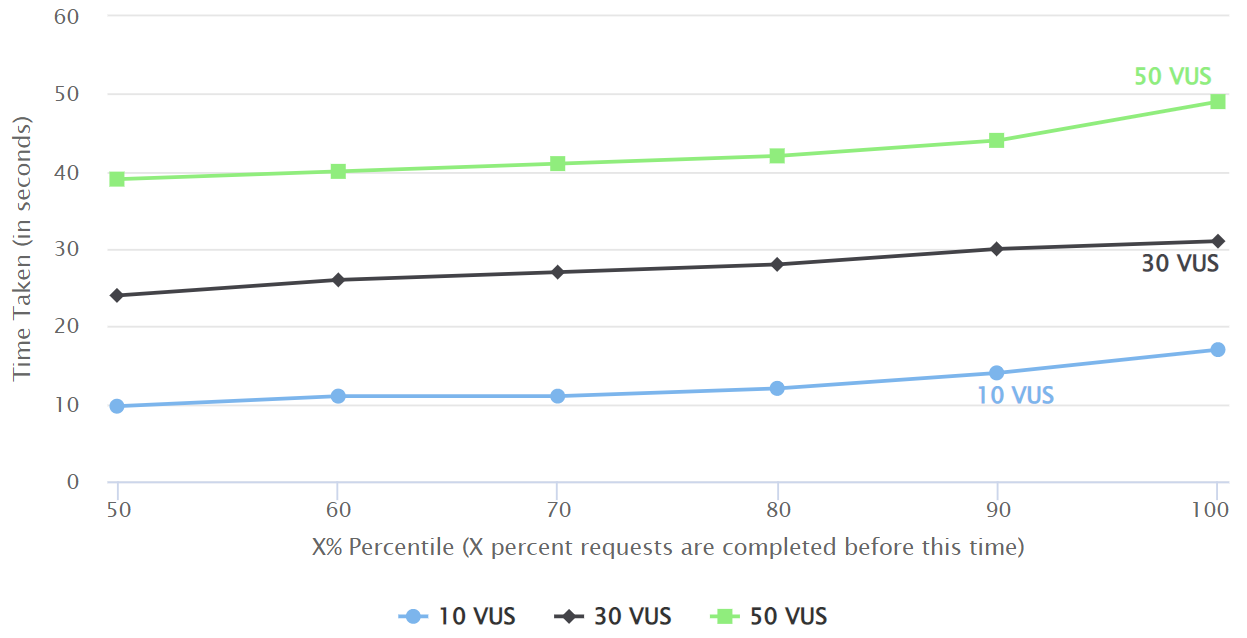
In the graph above:
-
X-axis represents X% (percentile) of request time. It means, X% requests have taken time less than or equal to Y-axis value at X%.
-
Y-axis represents the time taken by a virtual user to perform the BYOK (upload key) operation.
-
While calculating TPS, Locust informs about the time taken to complete X% requests when all the virtual users are spawned in parallel.
-
The number of virtual users does not significantly affect the number of keys being uploaded. This proves the rate limit implemented by SAP side causes throttling.