CipherTrust Manager System Monitoring
CipherTrust Manager as a Service has six mechanisms to monitor its system activity.
-
Server audit and client audit records include general auditable events available in the GUI, CLI, and REST API in a user-readable JSON format, which can be used to create alarms. By default, these are stored using a Loki Grafana microservice, as we recommend. Storage on local database instead of Loki Grafana is available, but deprecated.
Consult documentation for a specific CipherTrust connector for information on configuring and interpreting client records.
-
Host logs are very detailed messages at the base operating system level.
-
Debug logs are detailed downloadable LTSV files intended for troubleshooting CipherTrust Manager as a Service operations with Thales customer support. These include host logs as well as other logs.
-
KMIP and NAE activity logs are downloadable JSON format files that include information on operations performed through the KMIP and NAE interfaces.
-
Web activity logs are downloadable JSON format files that include information on operations performed through the web interface.
-
Prometheus Metrics Endpoint allows the Prometheus monitoring system to scrape the CipherTrust Manager as a Service continuously, providing metrics over time to help monitor overall system health, performance, and cryptographic activity. As well, there is a sample configuration available on request, including Prometheus and Grafana data visualization application Docker containers.
The system records and logs can be exported to various external locations.
-
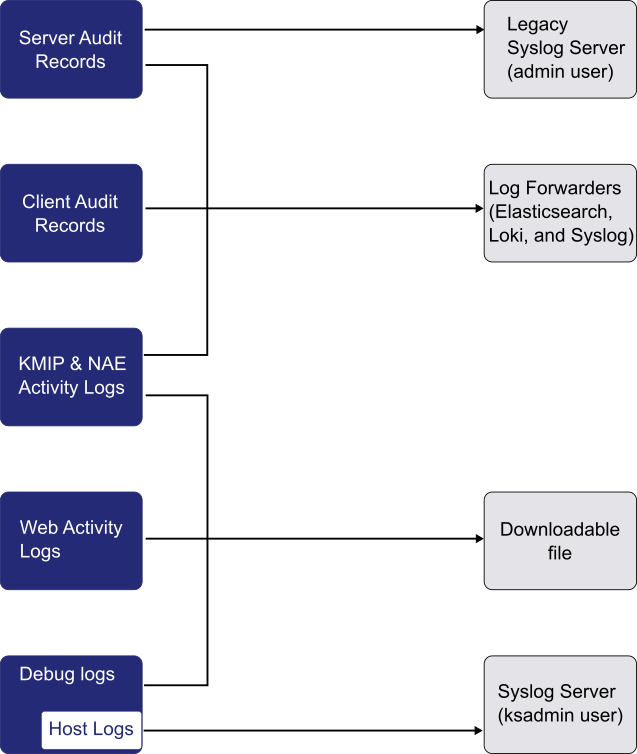
Server audit records can be sent to an legacy external syslog server controlled by the admin user, and through a log forwarder to Elasticsearch, Loki, or a syslog server.
-
Client audit records can be sent through a log forwarder to Elasticsearch, Loki, or syslog server.
-
KMIP and NAE activity logs can be sent through a log forwarder to Elasticsearch, Loki, or a syslog server and are downloadable to a JSON file.
-
Web activity logs are downloadable to a JSON file.
-
Host logs can be sent to an additional syslog server by the
ksadminuser. -
Debug logs, including host logs, are downloadable to an LTSV file as part of the Debug Logs package.