
Performance Summary
This section provides metrics and results of GCP performance testing.
Test Setup
| Test Runner | |
|---|---|
| Operating System | Ubuntu 18.4 |
| RAM | 8 GB |
| Core | 4 |
| Appliance | |
|---|---|
| Build | 2.11.0.8177 |
| RAM | 16 GB |
Process
Scripts are written on top of the Locust Framework for load and stress testing. The testing is done for create, read, update, and delete (CRUD) key operations with respect to different numbers of virtual users (VUS) over parallel connections, one for every virtual user.
CRUD Operations
Expand the headings below to view performance numbers.
Response with request coverage in percentile (10 VUS, 180 seconds)
Click the tabs to view performance numbers.
Table 1
| Method | Name | # Requests | # Fails | Average (ms) | Min (ms) | Max (ms) | Average size (bytes) | RPS | Failures/s |
|---|---|---|---|---|---|---|---|---|---|
| POST | /cckm/google/ upload-key |
207 | 0 | 8502 | 1306 | 14281 | 630 | 1.2 | 0.0 |
| Aggregated | Aggregated | 207 | 0 | 8502 | 1306 | 14281 | 630 | 1.2 | 0.0 |
Table 2
| Method | Name | 50%ile (ms) | 60%ile (ms) | 70%ile (ms) | 80%ile (ms) | 90%ile (ms) | 95%ile (ms) | 99%ile (ms) | 100%ile (ms) |
|---|---|---|---|---|---|---|---|---|---|
| POST | /cckm/google/ upload-key |
7200 | 8700 | 10000 | 12000 | 13000 | 13000 | 14000 | 14000 |
| Aggregated | Aggregated | 7200 | 8700 | 10000 | 12000 | 13000 | 13000 | 14000 | 14000 |
Click the tabs to view performance numbers.
Table 1
| Method | Name | # Requests | # Fails | Average (ms) | Min (ms) | Max (ms) | Average size (bytes) | RPS | Failures/s |
|---|---|---|---|---|---|---|---|---|---|
| GET | /cckm/google/ keys/[id] |
285 | 0 | 6097 | 4156 | 11275 | 1034 | 1.6 | 0.0 |
| Aggregated | Aggregated | 285 | 0 | 6097 | 4156 | 11275 | 1034 | 1.6 | 0.0 |
Table 2
| Method | Name | 50%ile (ms) | 60%ile (ms) | 70%ile (ms) | 80%ile (ms) | 90%ile (ms) | 95%ile (ms) | 99%ile (ms) | 100%ile (ms) |
|---|---|---|---|---|---|---|---|---|---|
| GET | /cckm/google/ keys/[id] |
5000 | 5900 | 7200 | 8500 | 9400 | 9900 | 11000 | 11000 |
| Aggregated | Aggregated | 5000 | 5900 | 7200 | 8500 | 9400 | 9900 | 11000 | 11000 |
Click the tabs to view performance numbers.
Table 1
| Method | Name | # Requests | # Fails | Average (ms) | Min (ms) | Max (ms) | Average size (bytes) | RPS | Failures/s |
|---|---|---|---|---|---|---|---|---|---|
| PATCH | /cckm/google/ keys/[id] |
246 | 0 | 7035 | 4482 | 11785 | 969 | 1.4 | 0.0 |
| Aggregated | Aggregated | 246 | 0 | 7035 | 4482 | 11785 | 969 | 1.4 | 0.0 |
Table 2
| Method | Name | 50%ile (ms) | 60%ile (ms) | 70%ile (ms) | 80%ile (ms) | 90%ile (ms) | 95%ile (ms) | 99%ile (ms) | 100%ile (ms) |
|---|---|---|---|---|---|---|---|---|---|
| PATCH | /cckm/google/ keys/[id] |
5900 | 6600 | 8100 | 9500 | 11000 | 11000 | 12000 | 12000 |
| Aggregated | Aggregated | 5900 | 6600 | 8100 | 9500 | 11000 | 11000 | 12000 | 12000 |
Click the tabs to view performance numbers.
Table 1
| Method | Name | # Requests | # Fails | Average (ms) | Min (ms) | Max (ms) | Average size (bytes) | RPS | Failures/s |
|---|---|---|---|---|---|---|---|---|---|
| GET | /cckm/google/ keys/[id]/ versions |
225 | 0 | 6728 | 4080 | 14456 | 1481 | 1.3 | 0.0 |
| POST | /cckm/google/ keys/[id]/versions/ [versionID]/ schedule-destroy |
223 | 200 | 1123 | 978 | 1601 | 724 | 1.2 | 1.1 |
| Aggregated | Aggregated | 448 | 200 | 3938 | 978 | 14456 | 1104 | 2.5 | 1.1 |
Table 2
| Method | Name | 50%ile (ms) | 60%ile (ms) | 70%ile (ms) | 80%ile (ms) | 90%ile (ms) | 95%ile (ms) | 99%ile (ms) | 100%ile (ms) |
|---|---|---|---|---|---|---|---|---|---|
| GET | /cckm/google/ keys/[id]/ versions |
5300 | 6300 | 8100 | 9700 | 11000 | 11000 | 14000 | 14000 |
| POST | /cckm/google/ keys/[id]/versions/ [versionID]/ schedule-destroy |
1100 | 1100 | 1200 | 1200 | 1300 | 1400 | 1600 | 1600 |
| Aggregated | Aggregated | 4100 | 4500 | 4900 | 6300 | 9700 | 11000 | 12000 | 14000 |
Here, X% percentile indicates that X percent requests are completed before this time.
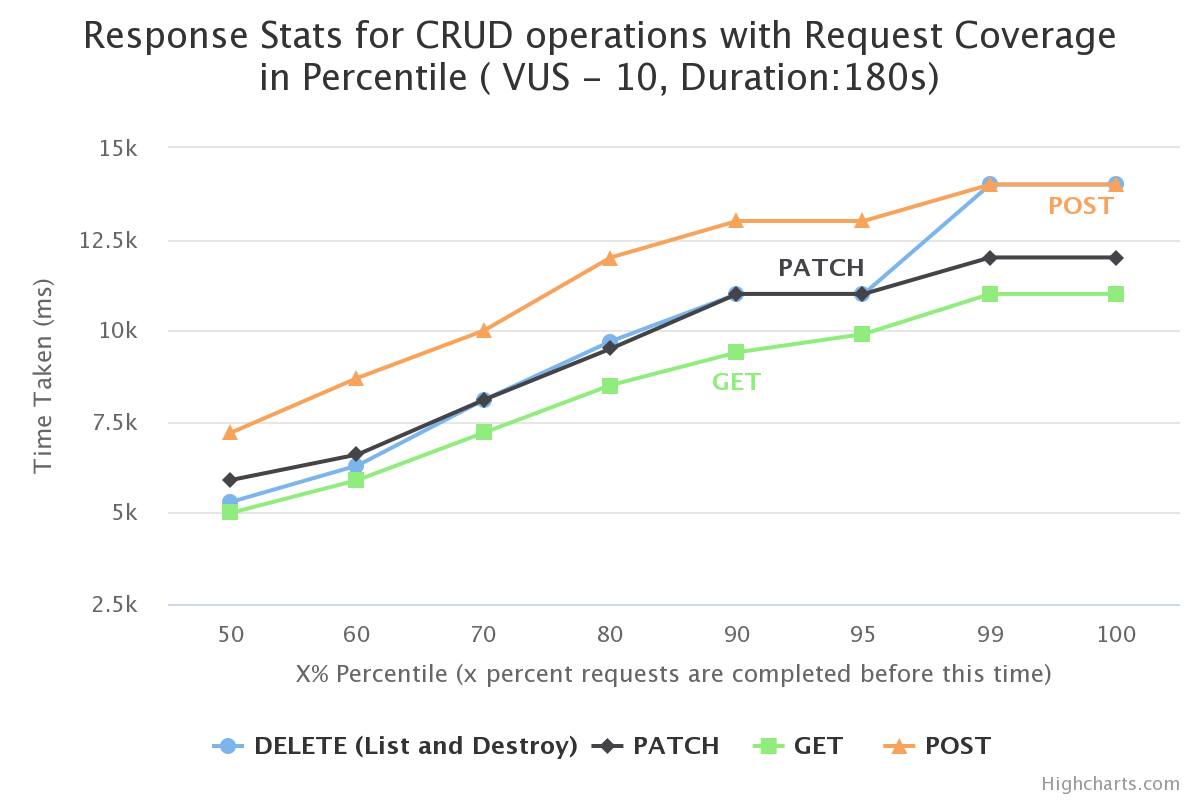
In the graph above:
-
X-axis represents X% (percentile) of request time. It means, X% requests have taken time less than or equal to Y-axis value at X%.
-
Y-axis represents the time taken by a virtual user to perform any CRUD operation.
-
All the virtual users are spawned parallely at the same time to perform each of these CRUD operations for the given duration.
Response with request coverage in percentile (30 VUS, 180 seconds)
Click the tabs to view performance numbers.
Table 1
| Method | Name | # Requests | # Fails | Average (ms) | Min (ms) | Max (ms) | Average size (bytes) | RPS | Failures/s |
|---|---|---|---|---|---|---|---|---|---|
| POST | /cckm/google/ upload-key |
207 | 0 | 23659 | 2793 | 29505 | 630 | 1.2 | 0.0 |
| Aggregated | Aggregated | 207 | 0 | 23659 | 2793 | 29505 | 630 | 1.2 | 0.0 |
Table 2
| Method | Name | 50%ile (ms) | 60%ile (ms) | 70%ile (ms) | 80%ile (ms) | 90%ile (ms) | 95%ile (ms) | 99%ile (ms) | 100%ile (ms) |
|---|---|---|---|---|---|---|---|---|---|
| POST | /cckm/google/ upload-key |
25000 | 27000 | 28000 | 29000 | 29000 | 29000 | 29000 | 30000 |
| Aggregated | Aggregated | 25000 | 27000 | 28000 | 29000 | 29000 | 29000 | 29000 | 30000 |
Click the tabs to view performance numbers.
Table 1
| Method | Name | # Requests | # Fails | Average (ms) | Min (ms) | Max (ms) | Average size (bytes) | RPS | Failures/s |
|---|---|---|---|---|---|---|---|---|---|
| GET | /cckm/google/ keys/[id] |
270 | 0 | 18602 | 12907 | 35524 | 1034 | 1.5 | 0.0 |
| Aggregated | Aggregated | 270 | 0 | 18602 | 12907 | 35524 | 1034 | 1.5 | 0.0 |
Table 2
| Method | Name | 50%ile (ms) | 60%ile (ms) | 70%ile (ms) | 80%ile (ms) | 90%ile (ms) | 95%ile (ms) | 99%ile (ms) | 100%ile (ms) |
|---|---|---|---|---|---|---|---|---|---|
| GET | /cckm/google/ keys/[id] |
19000 | 20000 | 22000 | 23000 | 23000 | 25000 | 34000 | 36000 |
| Aggregated | Aggregated | 19000 | 20000 | 22000 | 23000 | 23000 | 25000 | 34000 | 36000 |
Click the tabs to view performance numbers.
Table 1
| Method | Name | # Requests | # Fails | Average (ms) | Min (ms) | Max (ms) | Average size (bytes) | RPS | Failures/s |
|---|---|---|---|---|---|---|---|---|---|
| PATCH | /cckm/google/ keys/[id] |
221 | 0 | 22675 | 15652 | 37918 | 969 | 1.2 | 0.0 |
| Aggregated | Aggregated | 221 | 0 | 22675 | 15652 | 37918 | 969 | 1.2 | 0.0 |
Table 2
| Method | Name | 50%ile (ms) | 60%ile (ms) | 70%ile (ms) | 80%ile (ms) | 90%ile (ms) | 95%ile (ms) | 99%ile (ms) | 100%ile (ms) |
|---|---|---|---|---|---|---|---|---|---|
| PATCH | /cckm/google/ keys/[id] |
23000 | 24000 | 25000 | 25000 | 27000 | 29000 | 36000 | 38000 |
| Aggregated | Aggregated | 23000 | 24000 | 25000 | 25000 | 27000 | 29000 | 36000 | 38000 |
Click the tabs to view performance numbers.
Table 1
| Method | Name | # Requests | # Fails | Average (ms) | Min (ms) | Max (ms) | Average size (bytes) | RPS | Failures/s |
|---|---|---|---|---|---|---|---|---|---|
| GET | /cckm/google/ keys/[id]/ versions |
202 | 0 | 24001 | 16704 | 39826 | 1494 | 1.1 | 0.0 |
| POST | /cckm/google/ keys/[id]/ versions/[versionID]/ schedule-destroy |
201 | 194 | 450 | 300 | 810 | 669 | 1.1 | 1.1 |
| Aggregated | Aggregated | 403 | 194 | 12255 | 300 | 39826 | 1082 | 2.2 | 1.1 |
Table 2
| Method | Name | 50%ile (ms) | 60%ile (ms) | 70%ile (ms) | 80%ile (ms) | 90%ile (ms) | 95%ile (ms) | 99%ile (ms) | 100%ile (ms) |
|---|---|---|---|---|---|---|---|---|---|
| GET | /cckm/google/ keys/[id]/ versions |
24000 | 26000 | 26000 | 27000 | 29000 | 35000 | 39000 | 40000 |
| POST | /cckm/google/ keys/[id]/ versions/[versionID]/ schedule-destroy |
390 | 420 | 520 | 550 | 580 | 620 | 740 | 810 |
| Aggregated | Aggregated | 17000 | 19000 | 22000 | 26000 | 27000 | 29000 | 38000 | 40000 |
Here, X% percentile indicates that X percent requests are completed before this time.
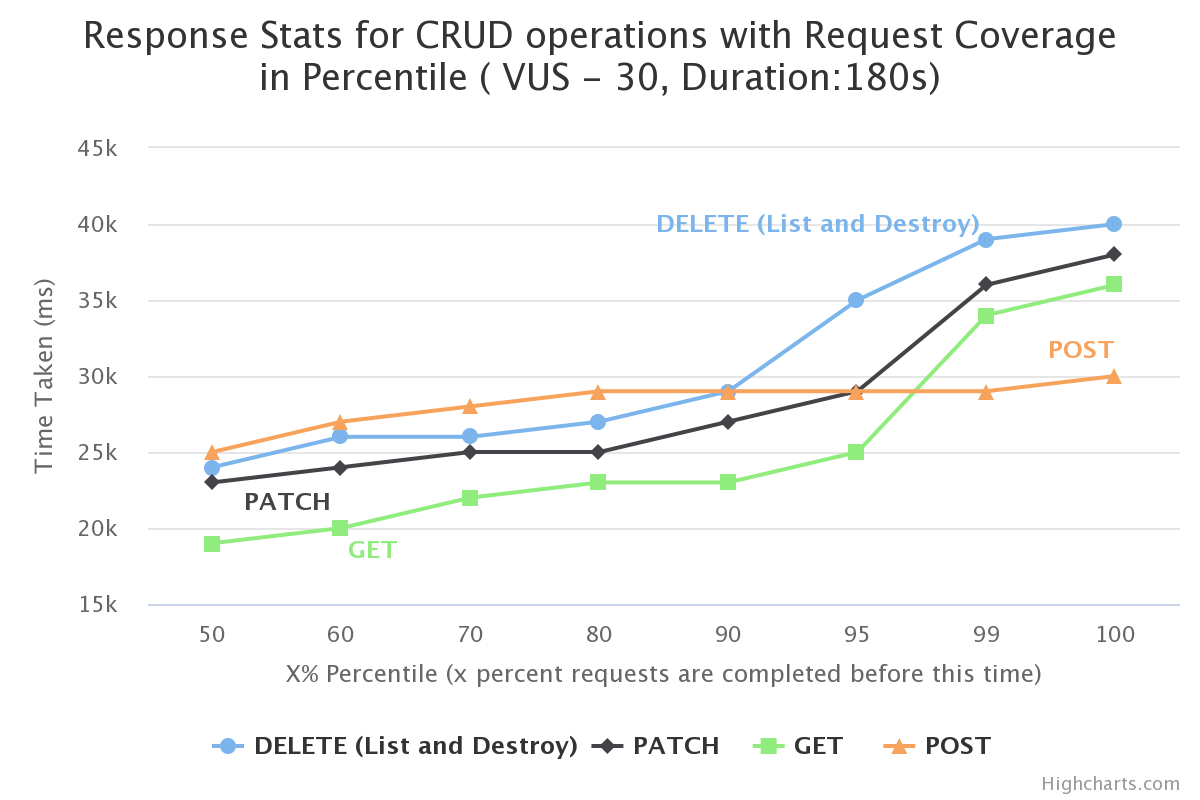
In the graph above:
-
X-axis represents X% (percentile) of request time. It means, X% requests have taken time less than or equal to Y-axis value at X%.
-
Y-axis represents the time taken by a virtual user to perform any CRUD operation.
-
All the virtual users are spawned parallely at the same time to perform each of these CRUD operations for the given duration.
Response with request coverage in percentile (50 VUS, 180 seconds)
Click the tabs to view performance numbers.
Table 1
| Method | Name | # Requests | # Fails | Average (ms) | Min (ms) | Max (ms) | Average size (bytes) | RPS | Failures/s |
|---|---|---|---|---|---|---|---|---|---|
| POST | /cckm/google/ upload-key |
203 | 0 | 37889 | 9291 | 47310 | 630 | 1.1 | 0.0 |
| Aggregated | Aggregated | 203 | 0 | 37889 | 9291 | 47310 | 630 | 1.1 | 0.0 |
Table 2
| Method | Name | 50%ile (ms) | 60%ile (ms) | 70%ile (ms) | 80%ile (ms) | 90%ile (ms) | 95%ile (ms) | 99%ile (ms) | 100%ile (ms) |
|---|---|---|---|---|---|---|---|---|---|
| POST | /cckm/google/ upload-key |
42000 | 42000 | 43000 | 44000 | 45000 | 46000 | 46000 | 47000 |
| Aggregated | Aggregated | 42000 | 42000 | 43000 | 44000 | 45000 | 46000 | 46000 | 47000 |
Click the tabs to view performance numbers.
Table 1
| Method | Name | # Requests | # Fails | Average (ms) | Min (ms) | Max (ms) | Average size (bytes) | RPS | Failures/s |
|---|---|---|---|---|---|---|---|---|---|
| GET | /cckm/google/ keys/[id] |
239 | 0 | 33494 | 25306 | 61685 | 1034 | 1.3 | 0.0 |
| Aggregated | Aggregated | 239 | 0 | 33494 | 25306 | 61685 | 1034 | 1.3 | 0.0 |
Table 2
| Method | Name | 50%ile (ms) | 60%ile (ms) | 70%ile (ms) | 80%ile (ms) | 90%ile (ms) | 95%ile (ms) | 99%ile (ms) | 100%ile (ms) |
|---|---|---|---|---|---|---|---|---|---|
| GET | /cckm/google/ keys/[id] |
32000 | 32000 | 32000 | 35000 | 45000 | 55000 | 61000 | 62000 |
| Aggregated | Aggregated | 32000 | 32000 | 32000 | 35000 | 45000 | 55000 | 61000 | 62000 |
Click the tabs to view performance numbers.
Table 1
| Method | Name | # Requests | # Fails | Average (ms) | Min (ms) | Max (ms) | Average size (bytes) | RPS | Failures/s |
|---|---|---|---|---|---|---|---|---|---|
| PATCH | /cckm/google/ keys/[id] |
202 | 0 | 38554 | 33081 | 65534 | 969 | 1.1 | 0.0 |
| Aggregated | Aggregated | 202 | 0 | 38554 | 33081 | 65534 | 969 | 1.1 | 0.0 |
Table 2
| Method | Name | 50%ile (ms) | 60%ile (ms) | 70%ile (ms) | 80%ile (ms) | 90%ile (ms) | 95%ile (ms) | 99%ile (ms) | 100%ile (ms) |
|---|---|---|---|---|---|---|---|---|---|
| PATCH | /cckm/google/ keys/[id] |
36000 | 37000 | 37000 | 39000 | 47000 | 54000 | 63000 | 66000 |
| Aggregated | Aggregated | 36000 | 37000 | 37000 | 39000 | 47000 | 54000 | 63000 | 66000 |
Click the tabs to view performance numbers.
Table 1
| Method | Name | # Requests | # Fails | Average (ms) | Min (ms) | Max (ms) | Average size (bytes) | RPS | Failures/s |
|---|---|---|---|---|---|---|---|---|---|
| GET | /cckm/google/ keys/[id]/ versions |
197 | 0 | 39153 | 30230 | 61986 | 1494 | 1.1 | 0.0 |
| POST | /cckm/google/ keys/[id]/ versions/[versionID]/ schedule-destroy |
196 | 192 | 1007 | 355 | 1748 | 657 | 1.1 | 1.1 |
| Aggregated | Aggregated | 393 | 192 | 20128 | 355 | 61986 | 1077 | 2.2 | 1.1 |
Table 2
| Method | Name | 50%ile (ms) | 60%ile (ms) | 70%ile (ms) | 80%ile (ms) | 90%ile (ms) | 95%ile (ms) | 99%ile (ms) | 100%ile (ms) |
|---|---|---|---|---|---|---|---|---|---|
| GET | /cckm/google/ keys/[id]/ versions |
37000 | 37000 | 38000 | 39000 | 48000 | 53000 | 61000 | 62000 |
| POST | /cckm/google/ keys/[id]/ versions/[versionID]/ schedule-destroy |
1000 | 1100 | 1100 | 1200 | 1300 | 1500 | 1600 | 1700 |
| Aggregated | Aggregated | 30000 | 37000 | 37000 | 37000 | 39000 | 48000 | 59000 | 62000 |
Here, X% percentile indicates that X percent requests are completed before this time.
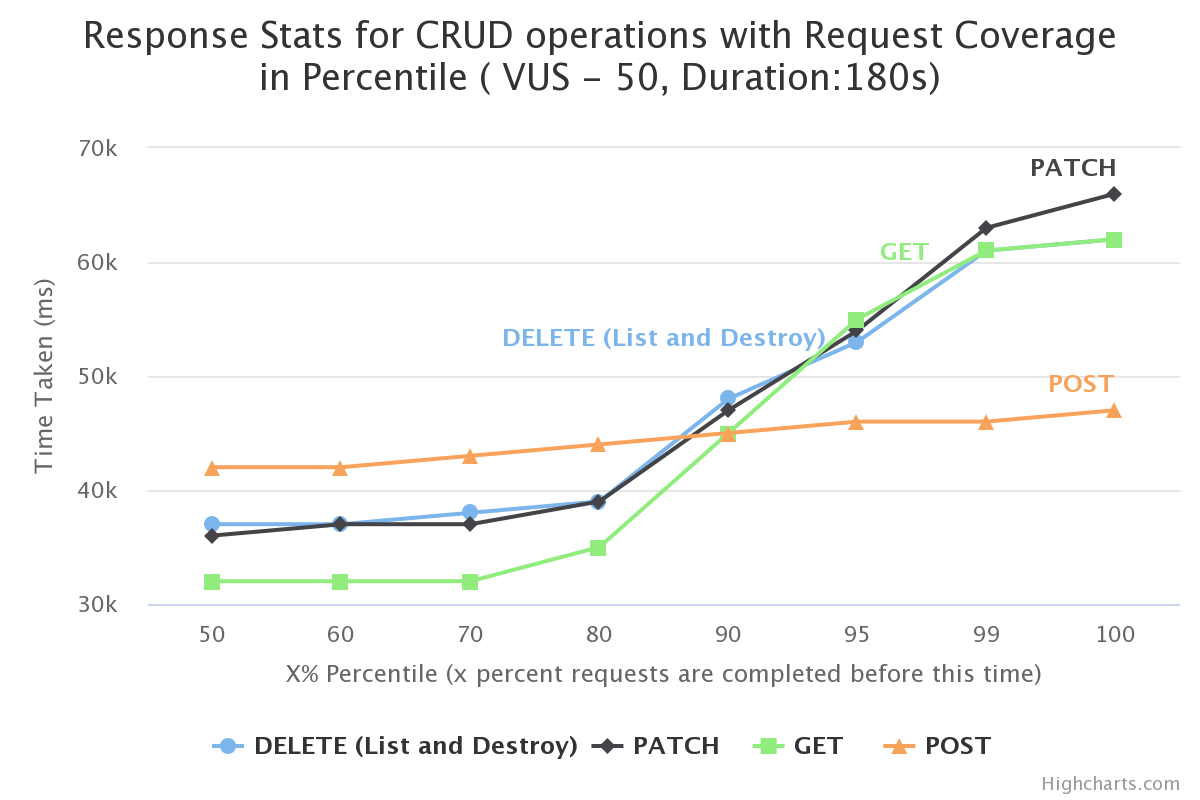
In the graph above:
-
X-axis represents X% (percentile) of request time. It means, X% requests have taken time less than or equal to Y-axis value at X%.
-
Y-axis represents the time taken by a virtual user to perform any CRUD operation.
-
All the virtual users are spawned parallely at the same time to perform each of these CRUD operations for the given duration.
Note
The delete operation includes listing key version(s) and schedule destroy. When multiple virtual users are executing the delete operation, more than 90% Bad request failures are observed with the status code 400. As the operation is synchronous, the behavior might be due a bottleneck on the GCP side when the requests are sent.