
Google EKM Performance Summary
We have tested ten environments to capture performance metrics for the CipherTrust Cloud Key Manager (CCKM) Google External Key Manager (EKM) integration. The below results demonstrate the effects of deployment choices on throughput for EKM endpoint wrap operations. This can help you plan your CipherTrust Manager deployment to meet your performance needs for Google EKM.
There is a Google requirement that wrap and unwrap requests must be completed within 150 ms, so results are presented to show the throughput possible before meeting that threshold.
Actual performance numbers in your environment can be different. The results can vary based on factors such as how and where the CipherTrust Manager is deployed, CipherTrust Manager resources, the location of clients, the network connectivity, and how the traffic is load-balanced.
Tested Environments
All environments used an open source k6.io tool as the REST client, run from a Debian virtual machine. The Virtual Machine was hosted on Google Cloud Platform in us central 1a zone with 8 vCPUs of 64 GB memory, and 50 GB memory disk.
The following CipherTrust Manager deployments were tested:
Google Cloud Platform deployments:
Single CipherTrust Manager with 4 CPUs and 16 GB RAM.
Single CipherTrust Manager with 8 CPUs and 64 GB RAM.
Two clustered CipherTrust Manager nodes with a load balancer, each with 4 CPUs and 16 GB RAM.
Two clustered CipherTrust Manager nodes with a load balancer, each with 8 CPUs and 64 GB RAM.
AWS Cloud deployments:
Single CipherTrust Manager with 4 CPUs and 16 GB RAM.
Single CipherTrust Manager with 8 CPUs and 64 GB RAM.
Azure Cloud deployments:
Single CipherTrust Manager with 4 CPUs and 16 GB RAM.
Single CipherTrust Manager with 8 CPUs and 64 GB RAM.
Single on-premises physical appliance, model CipherTrust Manager k470. See hardware specifications for memory and CPU values.
Single Virtual CipherTrust Manager k170v deployed in ESXi private cloud, with 4 CPUs, 16 GB RAM, and 50 GB HDD.
CipherTrust Managers were deployed as geographically close to the k6.io client as possible, to avoid potential network latencies which can occur when crossing geographic regions.In your EKM deployment, we similarly recommend deploying the Virtual CipherTrust Manager instance geographically close to one of the Google Cloud KMS regions where you intend to set up the Google Cloud KMS Key Ring.
Network Requirements
The following ports were opened to ensure CipherTrust Manager/CCKM communication:
| Type | Protocol | Port Range |
|---|---|---|
| SSH | TCP | 22 |
| HTTPS | TCP | 443 |
| PostgeSQL(for cluster) | TCP | 5432 |
Test Process
The test consisted of starting a given number of virtual users to perform wrap operations on the EKM endpoint. Each user simulated a separate thread.
Total test duration was 40 seconds for each reading. The test was divided into the following increments:
Ramp-up time was 5 seconds. Virtual users were started.
Test duration was 30 seconds for each reading. Virtual users make wrap requests during that time.
Ramp-down time was 5 seconds. Virtual users were stopped until there were zero active virtual users.
Repeating the Test in Your Environment
We have published the scripts used with k6.io on Github, for you to repeat the tests in your own environments as desired.
Google Cloud Deployment Results
For each environment, we chart operations per second against response time (within 90% of the operations). The Google threshold of 150 ms is shown.
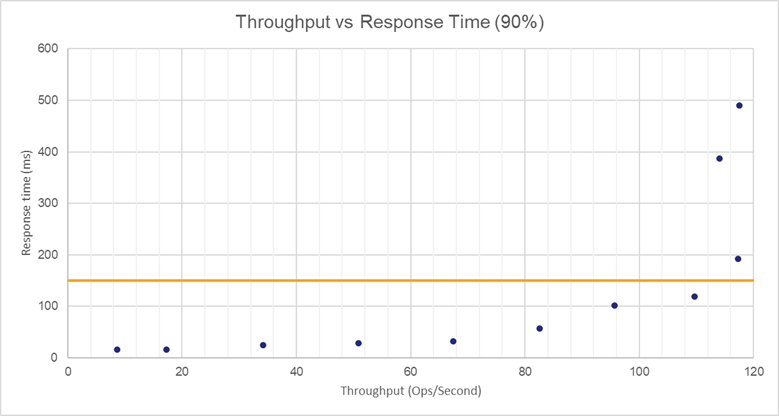
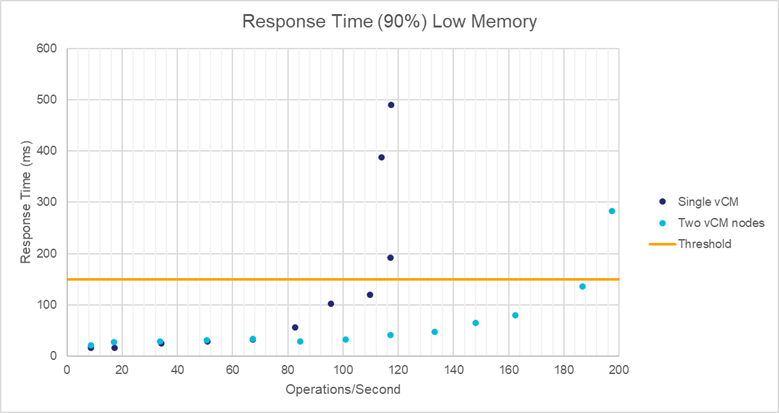
GCP Single Node Low Memory
This setup includes a single node with 4 CPUs and 16 GB memory.
| Operations/Second | Time Taken |
|---|---|
| 8.67 | 16.07 |
| 17.25 | 16.68 |
| 34.175 | 24.44 |
| 50.9 | 28.92 |
| 67.425 | 32.45 |
| 82.6 | 56.68 |
| 95.675 | 102.1 |
| 109.7 | 119.3 |
| 114 | 387.13 |
| 117.275 | 192.4 |
| 117.475 | 489.81 |
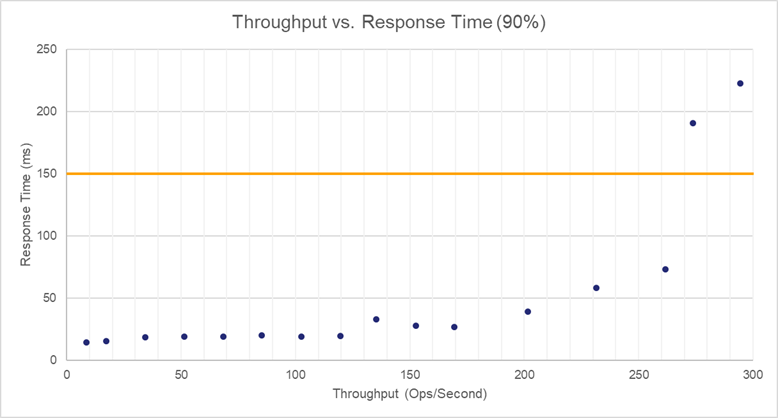
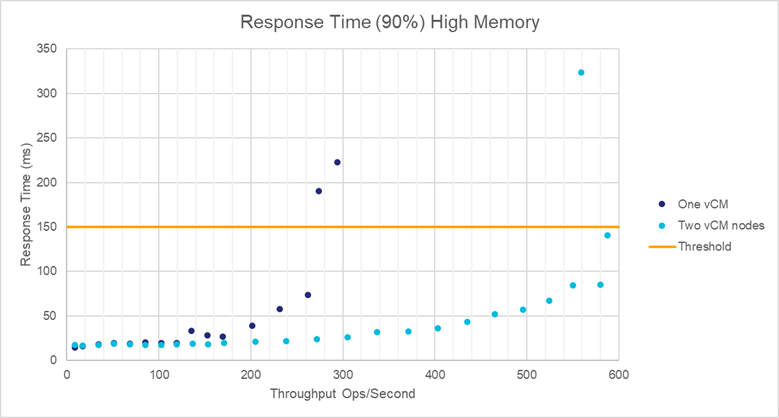
GCP Single Node High Memory
This setup includes a single node with 8 CPUs and 64 GB memory.
| Operations/Second | Time Taken |
|---|---|
| 8.7 | 14.8 |
| 17.25 | 15.83 |
| 34.25 | 18.52 |
| 51.3 | 19.36 |
| 68.375 | 19.12 |
| 85.35 | 20.37 |
| 102.5 | 19.35 |
| 119.55 | 19.88 |
| 135.35 | 33.33 |
| 152.6 | 27.93 |
| 169.4 | 26.76 |
| 201.675 | 39.31 |
| 231.4 | 58.11 |
| 261.725 | 73.39 |
| 273.725 | 190.38 |
| 294.325 | 222.58 |
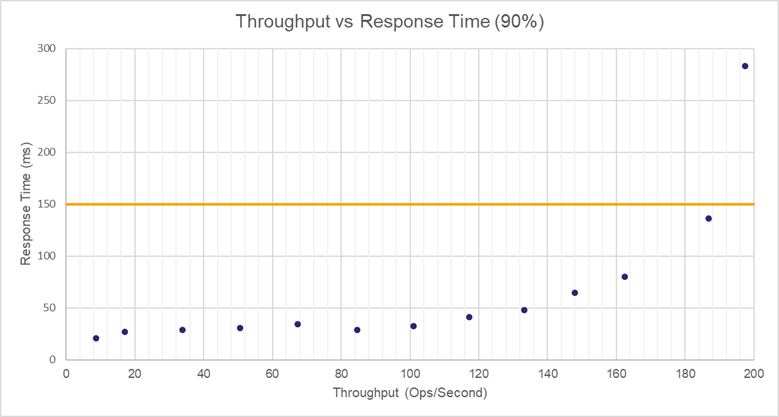
GCP Two Node Cluster Low Memory
This setup includes two clustered CipherTrust Manager nodes with a load balancer, each with 4 CPUs and 16 GB RAM.
| Operations/Second | Time Taken |
|---|---|
| 8.625 | 20.79 |
| 17 | 27.1 |
| 33.75 | 28.71 |
| 50.625 | 30.88 |
| 67.25 | 34.21 |
| 84.575 | 28.63 |
| 101.075 | 32.49 |
| 117.25 | 41.36 |
| 133.175 | 47.76 |
| 147.975 | 64.7 |
| 162.425 | 79.91 |
| 186.825 | 136.48 |
| 197.5 | 283.47 |
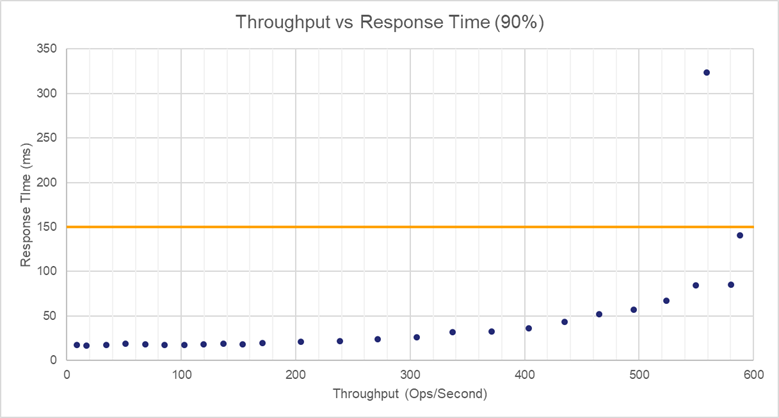
GCP Two Node Cluster High Memory
This setup includes two clustered CipherTrust Manager nodes with a load balancer, each with 8 CPUs and 64 GB RAM.
| Operations/Second | Time Taken |
|---|---|
| 8.675 | 17.32 |
| 17.25 | 16.73 |
| 34.25 | 17.38 |
| 51.35 | 18.74 |
| 68.5 | 18.05 |
| 85.6 | 17.62 |
| 102.65 | 17.62 |
| 119.7 | 18.16 |
| 136.575 | 19.03 |
| 153.825 | 18.31 |
| 170.775 | 19.57 |
| 204.75 | 21.01 |
| 238.525 | 21.77 |
| 271.775 | 24.16 |
| 305.45 | 25.95 |
| 337.25 | 31.64 |
| 371 | 32.41 |
| 403.525 | 35.85 |
| 435.175 | 43.06 |
| 464.925 | 52.03 |
| 495.55 | 57.3 |
| 524.05 | 66.95 |
| 549.825 | 84.29 |
| 558.95 | 323.87 |
| 580.25 | 85.2 |
| 587.95 | 140.89 |
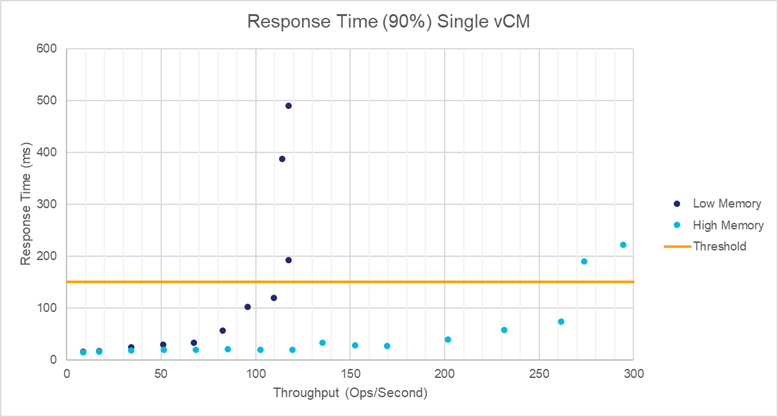
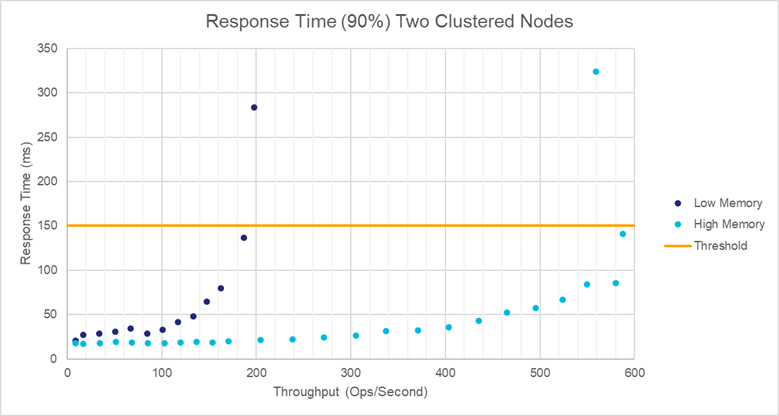
Google Cloud Environment Comparisons
The Google Cloud environments can be compared on the basis of adding memory, adding CPU, and adding an additional node.
Cluster Comparisons
Memory Comparisons
AWS Cloud Deployment Results
For each environment, we chart operations per second against response time (within 90% of the operations). The Google threshold of 150 ms is shown.
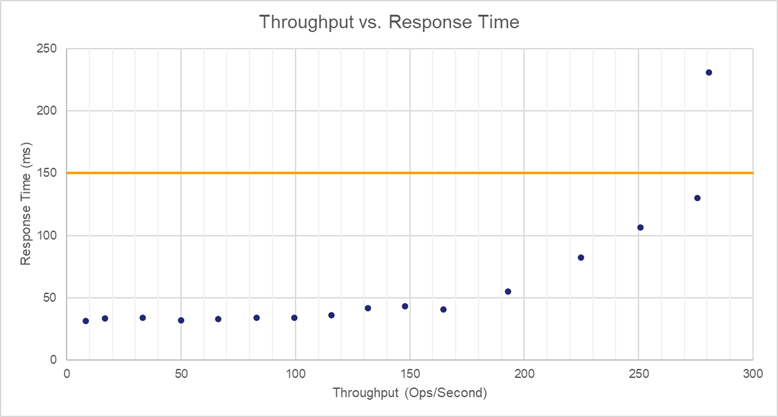
AWS Cloud Low Memory
This setup includes a single node with 4 CPUs and 16 GB memory.
| Operations/Second | Time Taken |
|---|---|
| 8.4 | 31.19 |
| 16.725 | 33.27 |
| 33.25 | 34.08 |
| 49.875 | 32 |
| 66.35 | 33.04 |
| 82.9 | 33.84 |
| 99.5 | 33.74 |
| 115.65 | 35.99 |
| 131.725 | 41.56 |
| 148.025 | 43.13 |
| 164.575 | 40.75 |
| 192.95 | 55.14 |
| 224.675 | 82.26 |
| 250.775 | 106.39 |
| 275.7 | 130.2 |
| 280.85 | 231.04 |
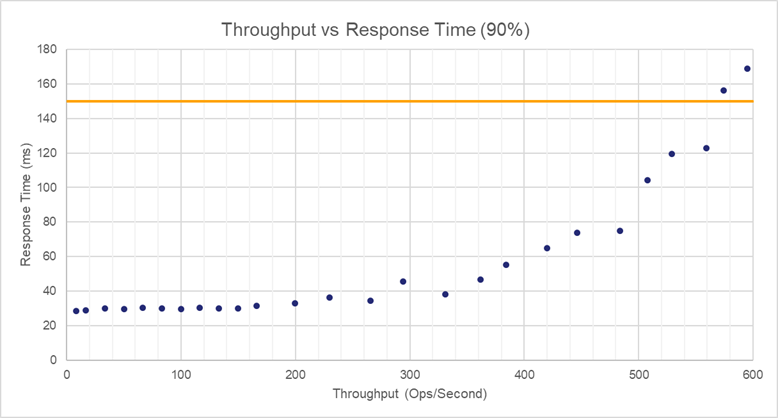
AWS Cloud High Memory
This setup includes a single node with 8 CPUs and 64 GB memory.
| Operations/Second | Time Taken |
|---|---|
| 8.425 | 28.51 |
| 33.25 | 30.23 |
| 50.075 | 29.84 |
| 66.55 | 30.59 |
| 83.425 | 30.14 |
| 99.975 | 29.69 |
| 116.35 | 30.4 |
| 133.275 | 30.09 |
| 149.825 | 30.07 |
| 166.25 | 31.54 |
| 199.325 | 33.12 |
| 229.95 | 36.57 |
| 265.35 | 34.5 |
| 293.85 | 45.65 |
| 330.775 | 38.24 |
| 361.775 | 46.67 |
| 384.225 | 55.3 |
| 419.75 | 65 |
| 446.175 | 73.86 |
| 483.85 | 74.81 |
| 507.95 | 104.39 |
| 528.775 | 119.47 |
| 559 | 122.65 |
| 574.125 | 156.26 |
| 594.85 | 168.8 |
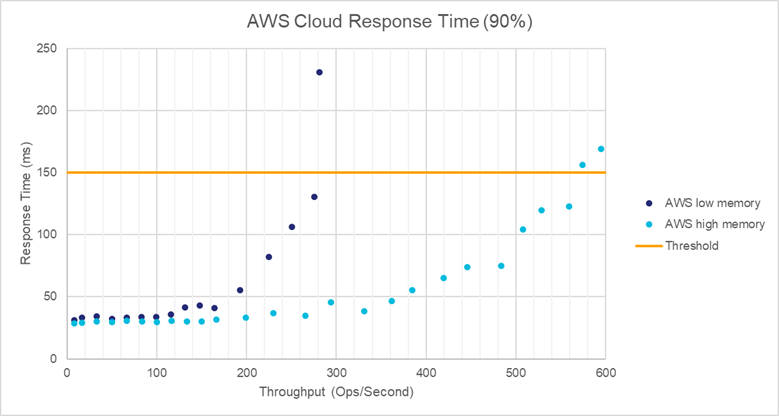
AWS Comparison
The effect of adding memory and CPUs cores can be compared on this cloud platform.
Azure Cloud Deployment Results
For each environment, we chart operations per second against response time (within 90% of the operations). The Google threshold of 150 ms is shown.
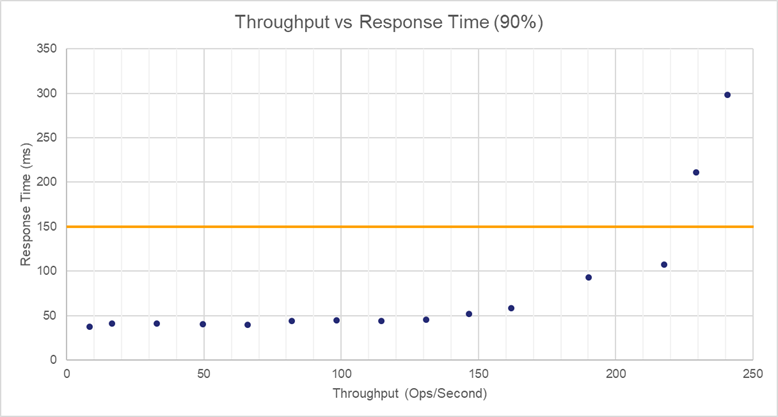
Azure Cloud Low Memory
This setup includes a single node with 4 CPUs and 16 GB memory.
| Operations/Second | Time Taken |
|---|---|
| 8.35 | 37.29 |
| 16.5 | 41.04 |
| 32.9 | 41.07 |
| 49.5 | 40.24 |
| 65.825 | 39.53 |
| 82.075 | 44.18 |
| 98.325 | 44.93 |
| 114.675 | 44.12 |
| 130.875 | 45.36 |
| 146.475 | 51.87 |
| 162.025 | 58.47 |
| 190.075 | 93.01 |
| 217.7 | 107.27 |
| 229.325 | 211.43 |
| 240.6 | 298.59 |
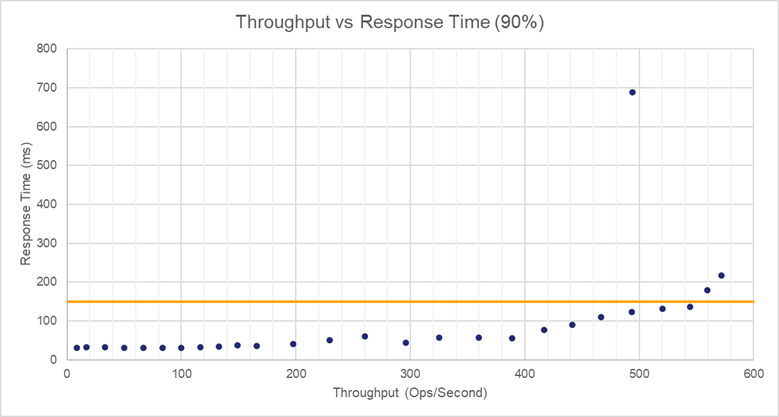
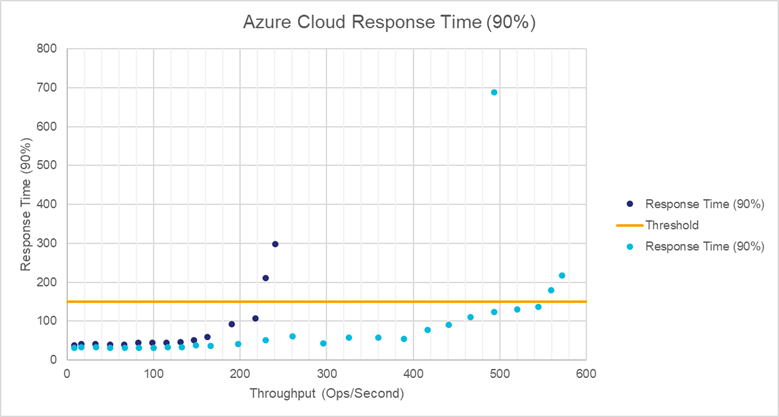
Azure Cloud High Memory
This setup includes a single node with 8 CPUs and 64 GB memory.
| Operations/Second | Time Taken |
|---|---|
| 8.4 | 31.19 |
| 16.75 | 32.33 |
| 33.2 | 32.48 |
| 49.975 | 31.68 |
| 66.6 | 30.97 |
| 83.275 | 30.65 |
| 99.975 | 30.56 |
| 116.35 | 33.25 |
| 132.825 | 33.57 |
| 148.85 | 37.3 |
| 165.925 | 35.75 |
| 197.875 | 40.38 |
| 229.675 | 50.99 |
| 260.325 | 60.44 |
| 296.175 | 43.47 |
| 325.375 | 57.63 |
| 359.575 | 57.94 |
| 388.95 | 55.12 |
| 416.65 | 77 |
| 441.3 | 90.91 |
| 466.425 | 110.47 |
| 493.475 | 123.4 |
| 520.125 | 130.77 |
| 544.575 | 136.45 |
| 559.7 | 179.1 |
| 571.8 | 216.89 |
| 493.775 | 687.56 |
Azure Cloud Comparison
The effect of adding memory and CPUs cores can be compared on this cloud platform.
On-Premises Deployment Results
For each environment, we chart operations per second against response time (within 90% of the operations). The Google threshold of 150 ms is shown.
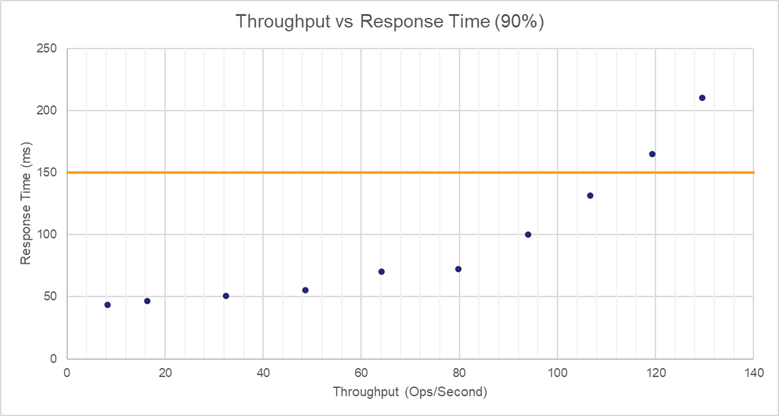
Physical Appliance
This setup includes a single on-premises physical appliance, model CipherTrust Manager k470. See hardware specifications for memory and CPU values.
| Operations/Second | Time Taken |
|---|---|
| 8.25 | 43.38 |
| 16.35 | 46.37 |
| 32.425 | 50.88 |
| 48.55 | 55.4 |
| 64.15 | 70.26 |
| 79.725 | 72.13 |
| 93.975 | 99.97 |
| 106.725 | 131.61 |
| 119.325 | 164.84 |
| 129.5 | 210.14 |
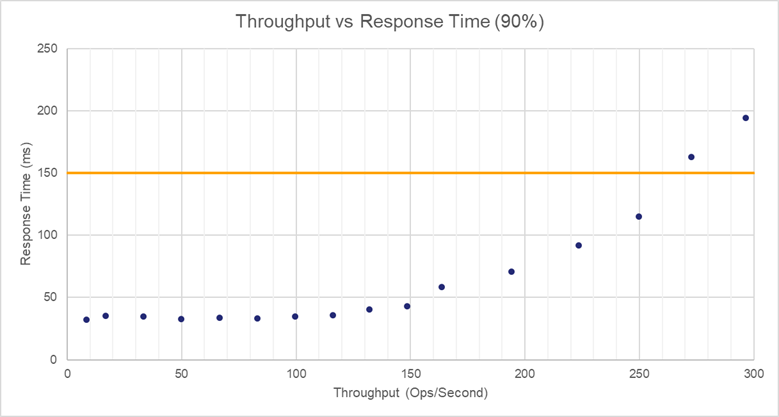
Virtual CipherTrust Manager on Private ESXi Server
Single Virtual CipherTrust Manager k170v deployed in ESXi private cloud, with 4 CPUs, 16 GB RAM, and 50 GB HDD.
| Operations/Second | Time Taken |
|---|---|
| 8.4 | 32.01 |
| 16.725 | 35.15 |
| 33.25 | 35.02 |
| 49.875 | 32.72 |
| 66.475 | 33.56 |
| 83.1 | 33.22 |
| 99.575 | 34.74 |
| 116.05 | 35.94 |
| 132.15 | 40.32 |
| 148.45 | 42.83 |
| 163.55 | 58.43 |
| 194.15 | 70.75 |
| 223.35 | 91.78 |
| 249.875 | 114.85 |
| 272.775 | 163.1 |
| 296.45 | 194.45 |
| 330.525 | 161.97 |
| 336.975 | 243.3 |
| 349.175 | 301.4 |
| 356.2 | 359.85 |
| 357.55 | 449.2 |
Conclusion
Adding a second load balanced node scales performance approximately linearly. A larger performance increase was observed from adding CPU and RAM in each cloud environment.